How do I add datasets to an Adhoc Blank Starter Report?
Warning: Before you can add datasets to the Adhoc Blank Starter Report, you must save the report to a client custom folder. For more information, see How do I save an Adhoc Starter Report to a client custom folder?.
To add new datasets in the Adhoc Report Builder
-
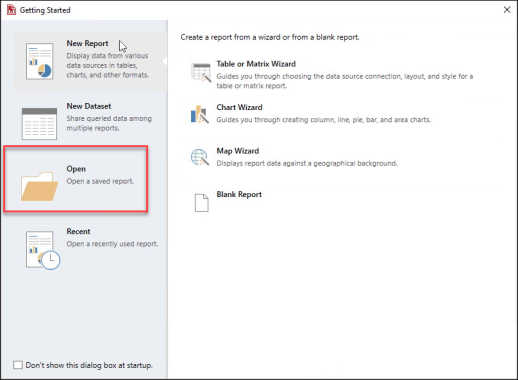
Do one of the following:
-
On the Getting Started page, click Open.
-
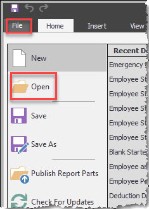
Click File > Open on the Adhoc Report Builder menu bar.
-
-
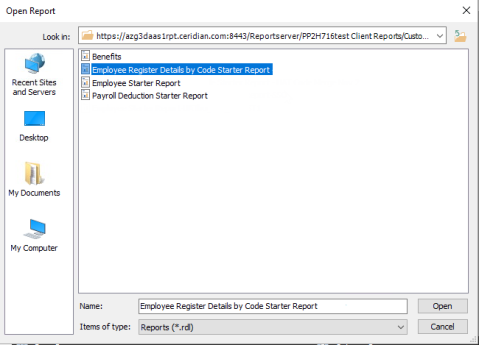
On the Open Report window, select the report to open and click Open.
- In the Report Data navigation pane:
- Double-click Data Sources.
- Double-click Powerpay.
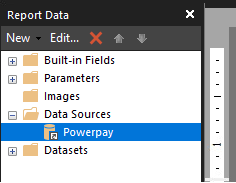
The Data Source Properties window opens.
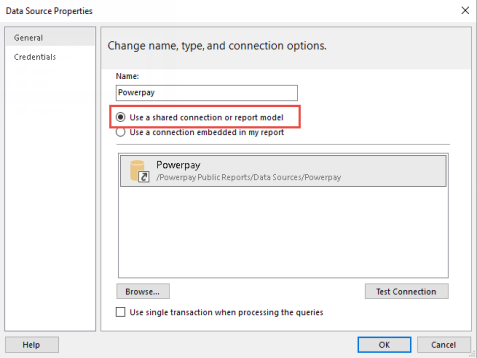
- Click Use a shared connection or report model.
-
If the company data source Powerpay appears, skip to step 5.
If Powerpay doesn't appear:
- Click Browse.
- Double-click the Client Reports folder.
- Double-click the Data Sources folder.
- Click Powerpay.
- Select the company data source (Powerpay), and click Test Connection.
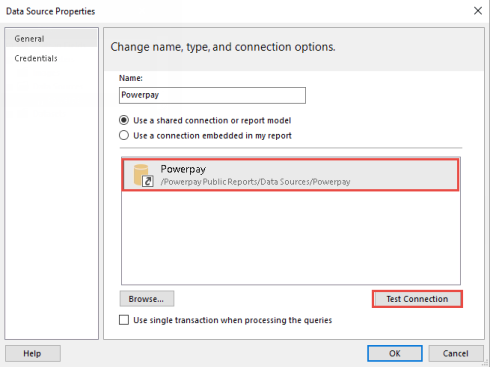
- Click OK.
- Click OK to close the Data Source Properties window.
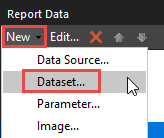
- In the Report Data navigation panel, click New > Dataset.
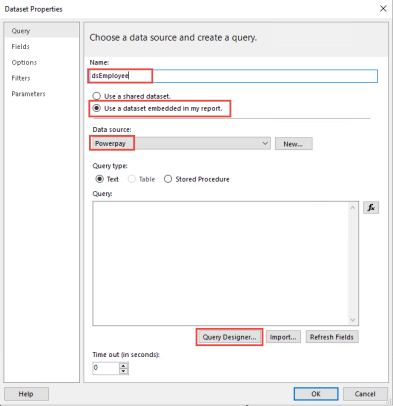
- On the Dataset Properties window:
- Accept the default or enter a new dataset name.
Note: When adding new dataset names, Dayforce recommends adding ds as the first two characters of each dataset name. For example, for an Employee dataset, you would add dsEmployee
- Select Use a database embedded in my report.
- In the Data Source field, select Powerpay.
- Click Query Designer.
The Query Designer window opens. Select the views (commonly known as tables) and fields to use for the report.
- Accept the default or enter a new dataset name.
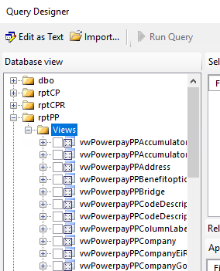
- In the Database View section, select the Views folder under one of the rpt folders.
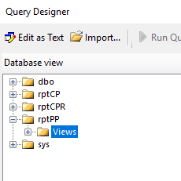
Depending on your selection, a list of all available views appears.
rptPP:
-
Expand the View you want to use, and a list of all available fields (also known as columns) for that view appears.
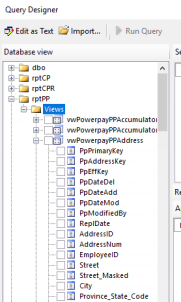
- To select:
- All fields for the view, click the check box to the left of the View.
- One or more fields for the view, click the box to the left of each field you want to select.
Tip: Dayforce recommends selecting individual fields instead of selecting all fields for a view.
All selected fields appear in the Selected fields section of the Query Designer window.
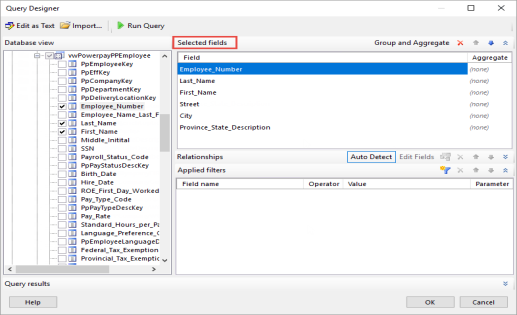
Note: To retrieve all the fields needed for a report, you need to select fields from more than one view. For example, in this Help topic, fields are selected for the vwPowerpayPPAddress and vwPowerpayPPEmployee views.
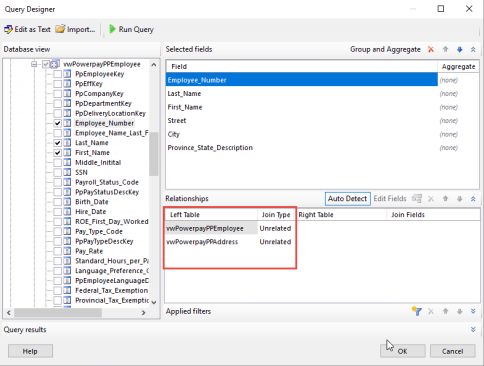
- After you select the desired fields from each view, use the tool bar in the Relationships section to complete the following steps:

- If the Relationships section isn't expanded, click the double arrow (
 ).
). Click Auto Detect, and the following values appear in the Relationship section:
- Left Table column - The views you previously selected.
- Join Type column - Unrelated. Indicates that the selected views aren't currently linked.
Click Auto Detect again, and the selected views no longer appear.
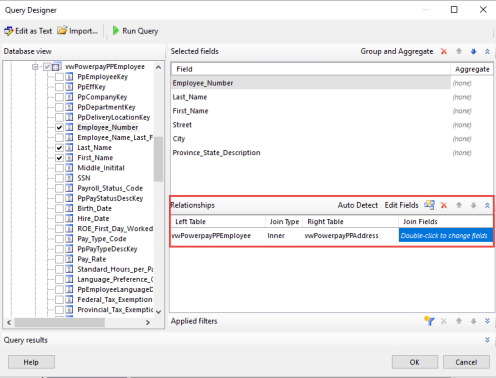
- On the tool bar, click the Add Relationship icon (
 ) to link views.
 - Click in the Left Table column and select a view.
Click in the Join Type column and select the type of join to use to link the two views.
Note: The Inner join is the most commonly-used join type.
- Click in the Right Table column to elect another view.
In the Join Fields column, click Double-click to change fields.
- If the Relationships section isn't expanded, click the double arrow (
- After you select the desired fields from each view, use the tool bar in the Relationships section to complete the following steps:
-
On the Edit Related Fields window that opens, click the Add Fields icon (
) on the tool bar.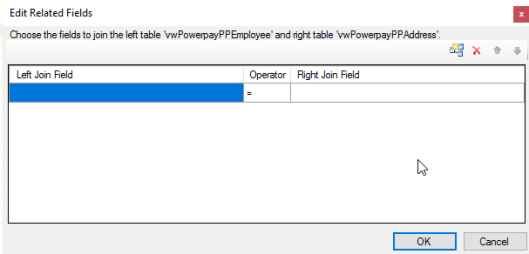
- Click in the Left Join Field column and select the Primary key field for your main view.
-
Click in the Right Join Field column and select the Secondary key field for the next view.
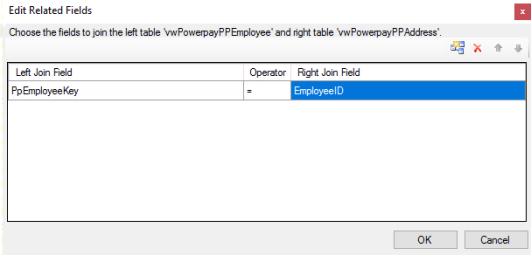
- Click OK.
- Click OK on the Query Designer window.
- Click OK on the Dataset Properties window.
-
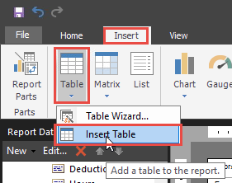
In the Adhoc Report Builder menu bar, click Insert > Table > Insert Table.
- To insert the table, click your cursor in the body of the report.
- From the Report Data navigation panel locate the dataset you added.
- One by one, select each field to add to the report and drag and drop it into the inserted table in the report body.
-
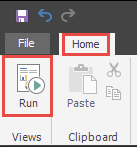
When all fields are selected, click Home > Run on the Adhoc Report Builder menu bar.
- To filter the information you want to appear on the report, in the Pay Group field, select one or more pay groups.
Caution: Each time you click Run, you must select one or more pay groups.
- Click View Report.
The following message appears: “Connection created successfully.”